Here's the latest news about the Dallas real estate market. Every quarter we update this page with the most recent real estate data from out local MLS (NTREIS: North Texas Real Estate Information Systems). Let us know if you have a house to sell or if you are moving to the Dallas area. We specialize in local housing market data.
Check out our Dallas zip code map below to see how your area performed in the 1st quarter 2023 compared to 1st quarter 2022. Zoom in and click on any zip code to see the most important real estate metrics.
Flat
Down 10% or More
The Current State of the Housing Market in Dallas TX
Average Sales Price:
$470,453
+2.9% Quarter over Quarter Increase
Average Sales Price in 1st Qtr 2022: $457,001
Months of Inventory (Absorption Rate) in Dallas TX
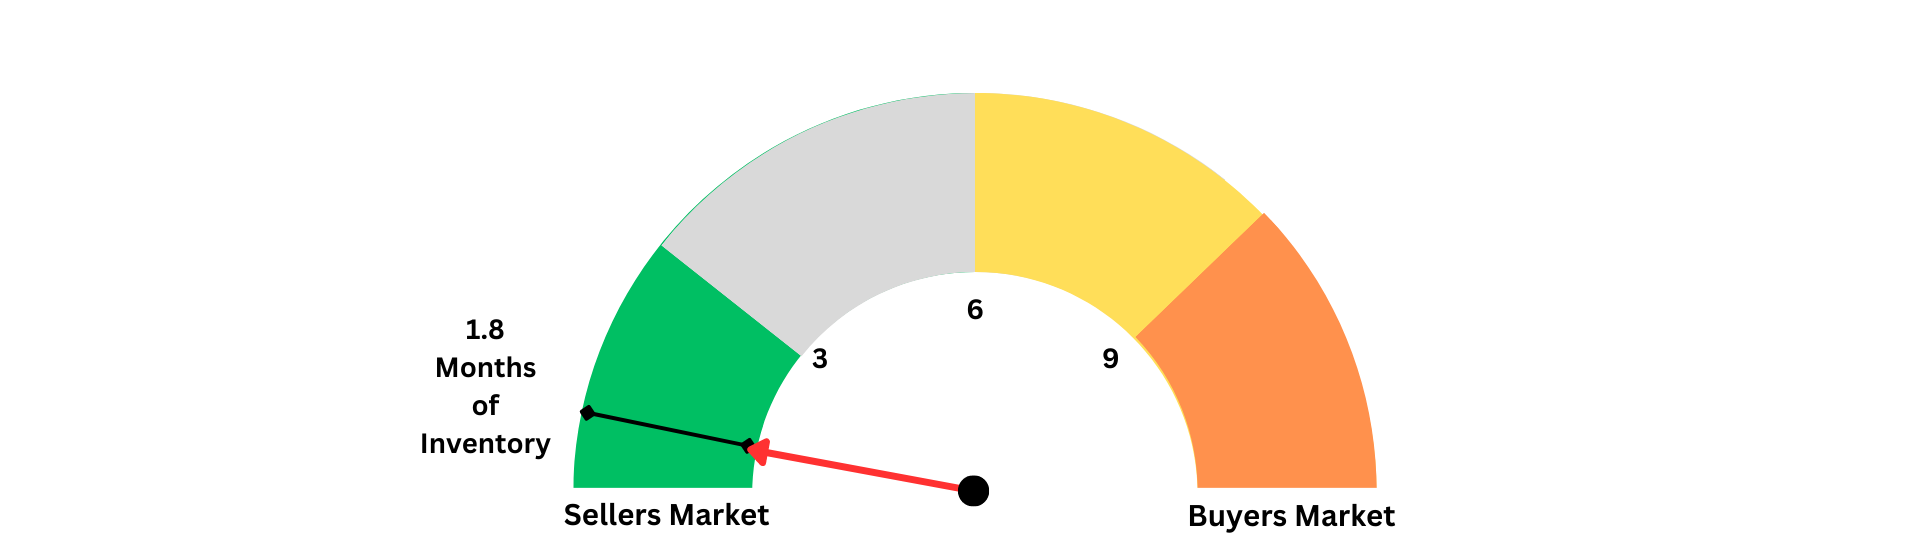
Summary: Whether it's called Months of Inventory, Absorption Rate, or Months Supply they are all one in the same. This is a very important ratio in real estate that measures how fast or how slow real estate is moving anywhere at any one time. The currents months supply in Dallas in the 1st quarter of 2023 is a very low 1.8 months.
In the 1st quarter of 2022 the months of inventory was and extremely low 0.9 months. Although it has doubled year over year homes are still moving very fast leaning heavily into Sellers Market territory.
Calculation: If you have 9 homes on currentyly on the market for sale (FS) and 5 homes sold (HS), you can expect all 9 of those homes currently on the market for sale to sell in 1.8 months.
FS / HS = Months of Inventory
Rule of Thumb: 1-4 months of inventory is seen as a Sellers Market, 5-7 months of inventory is seen as a Buyers Market, 7 months of inventory or more is seen as a stagnate market.
Days On Market: 43
+18 more days on market increase Quarter over Quarter
Average days on market 1st Quarter 2022: 25 Days